Multi-Protein Quantitation Workflow Tools for Host Cell Protein Discovery
Introducing the new multi-protein quantitation mass spectrometric analysis workflow tools for discovery-phase protein scientists.
Introduction
Poster by: Lawrie Veale, Antony Harvey, Krisztina Radi, Lukas Tvrdy, Michael Georgoulopoulos - Protein Metrics, LLC, Boston, MA.
Aim: Introduce the new multi-protein quantitation mass spectrometric analysis workflow tools for discovery-phase protein scientists.
- These workflows will help scientists in every phase of biopharmaceutical discovery and development from early cell line development to final drug purity verification.
- These workflows produce auto-curated analysis for quantification of thousands of proteins from sample replicates, quickly processing gigabytes of input data.
- The Byosphere cloud platform rapidly compares data across samples, projects, and geographic sites leveraging Deep Query and Dashboard capabilities in a GxP compliance-ready environment.
Abstract
Here, we introduce new multi-protein quantitation (MPQ) software workflows, which process gigabytes of input data, and produce auto-curated analyses for quantitative measurement of thousands of proteins from a sample replicate. MPQ workflows can be used within Protein Metrics Byos desktop software platform, or the Byosphere cloud-based platform.
In this work, we performed two NIST MAM Comparison Studies, where samples from different labs and sample conditions were analyzed with the MPQ workflows, and the host cell proteins were identified, quantified, and reported at a proteome-wide scale.
Vendor-Neutral, Application-Specific Workflows Identify and Quantify Thousands of Proteins
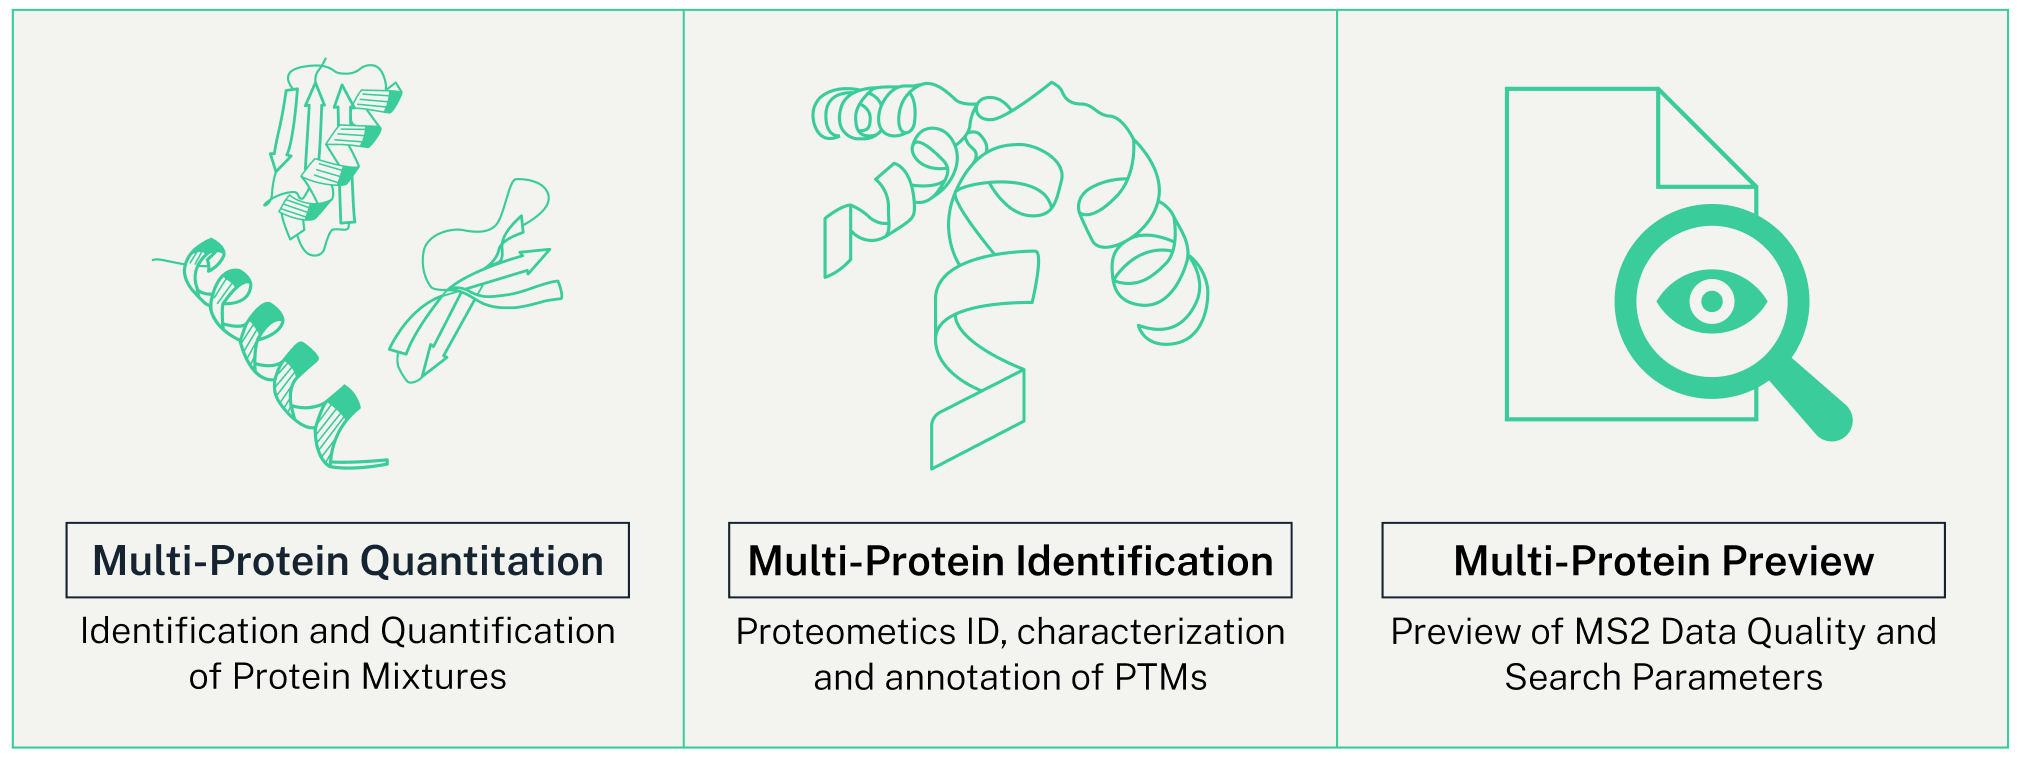
Multi-Protein Quantitation:
- Rapid analysis that immediately shows you the relative abundance of a complex mixture of proteins
- Label-free Quantitative analysis of thousands of proteins at a time
- Protein-centric analysis
- Dynamic Filtering allows analyst control over peptide quantitation during and after project creation
Multi-Protein Preview to automatically assess sample status:
- Mass spectrometer calibration/performance
- Enzymatic digestion specificity
- Alkylation efficiency
- Sample quality/unexpected artifacts
Multi-Protein Identification to search and identify thousands of proteins:
- Protein-centric layout
- Focused review
- Quicker result verification
- Built by the same team that created the ground-breaking Byonic algorithm
Dynamic Filtering & Protein Centric Views:
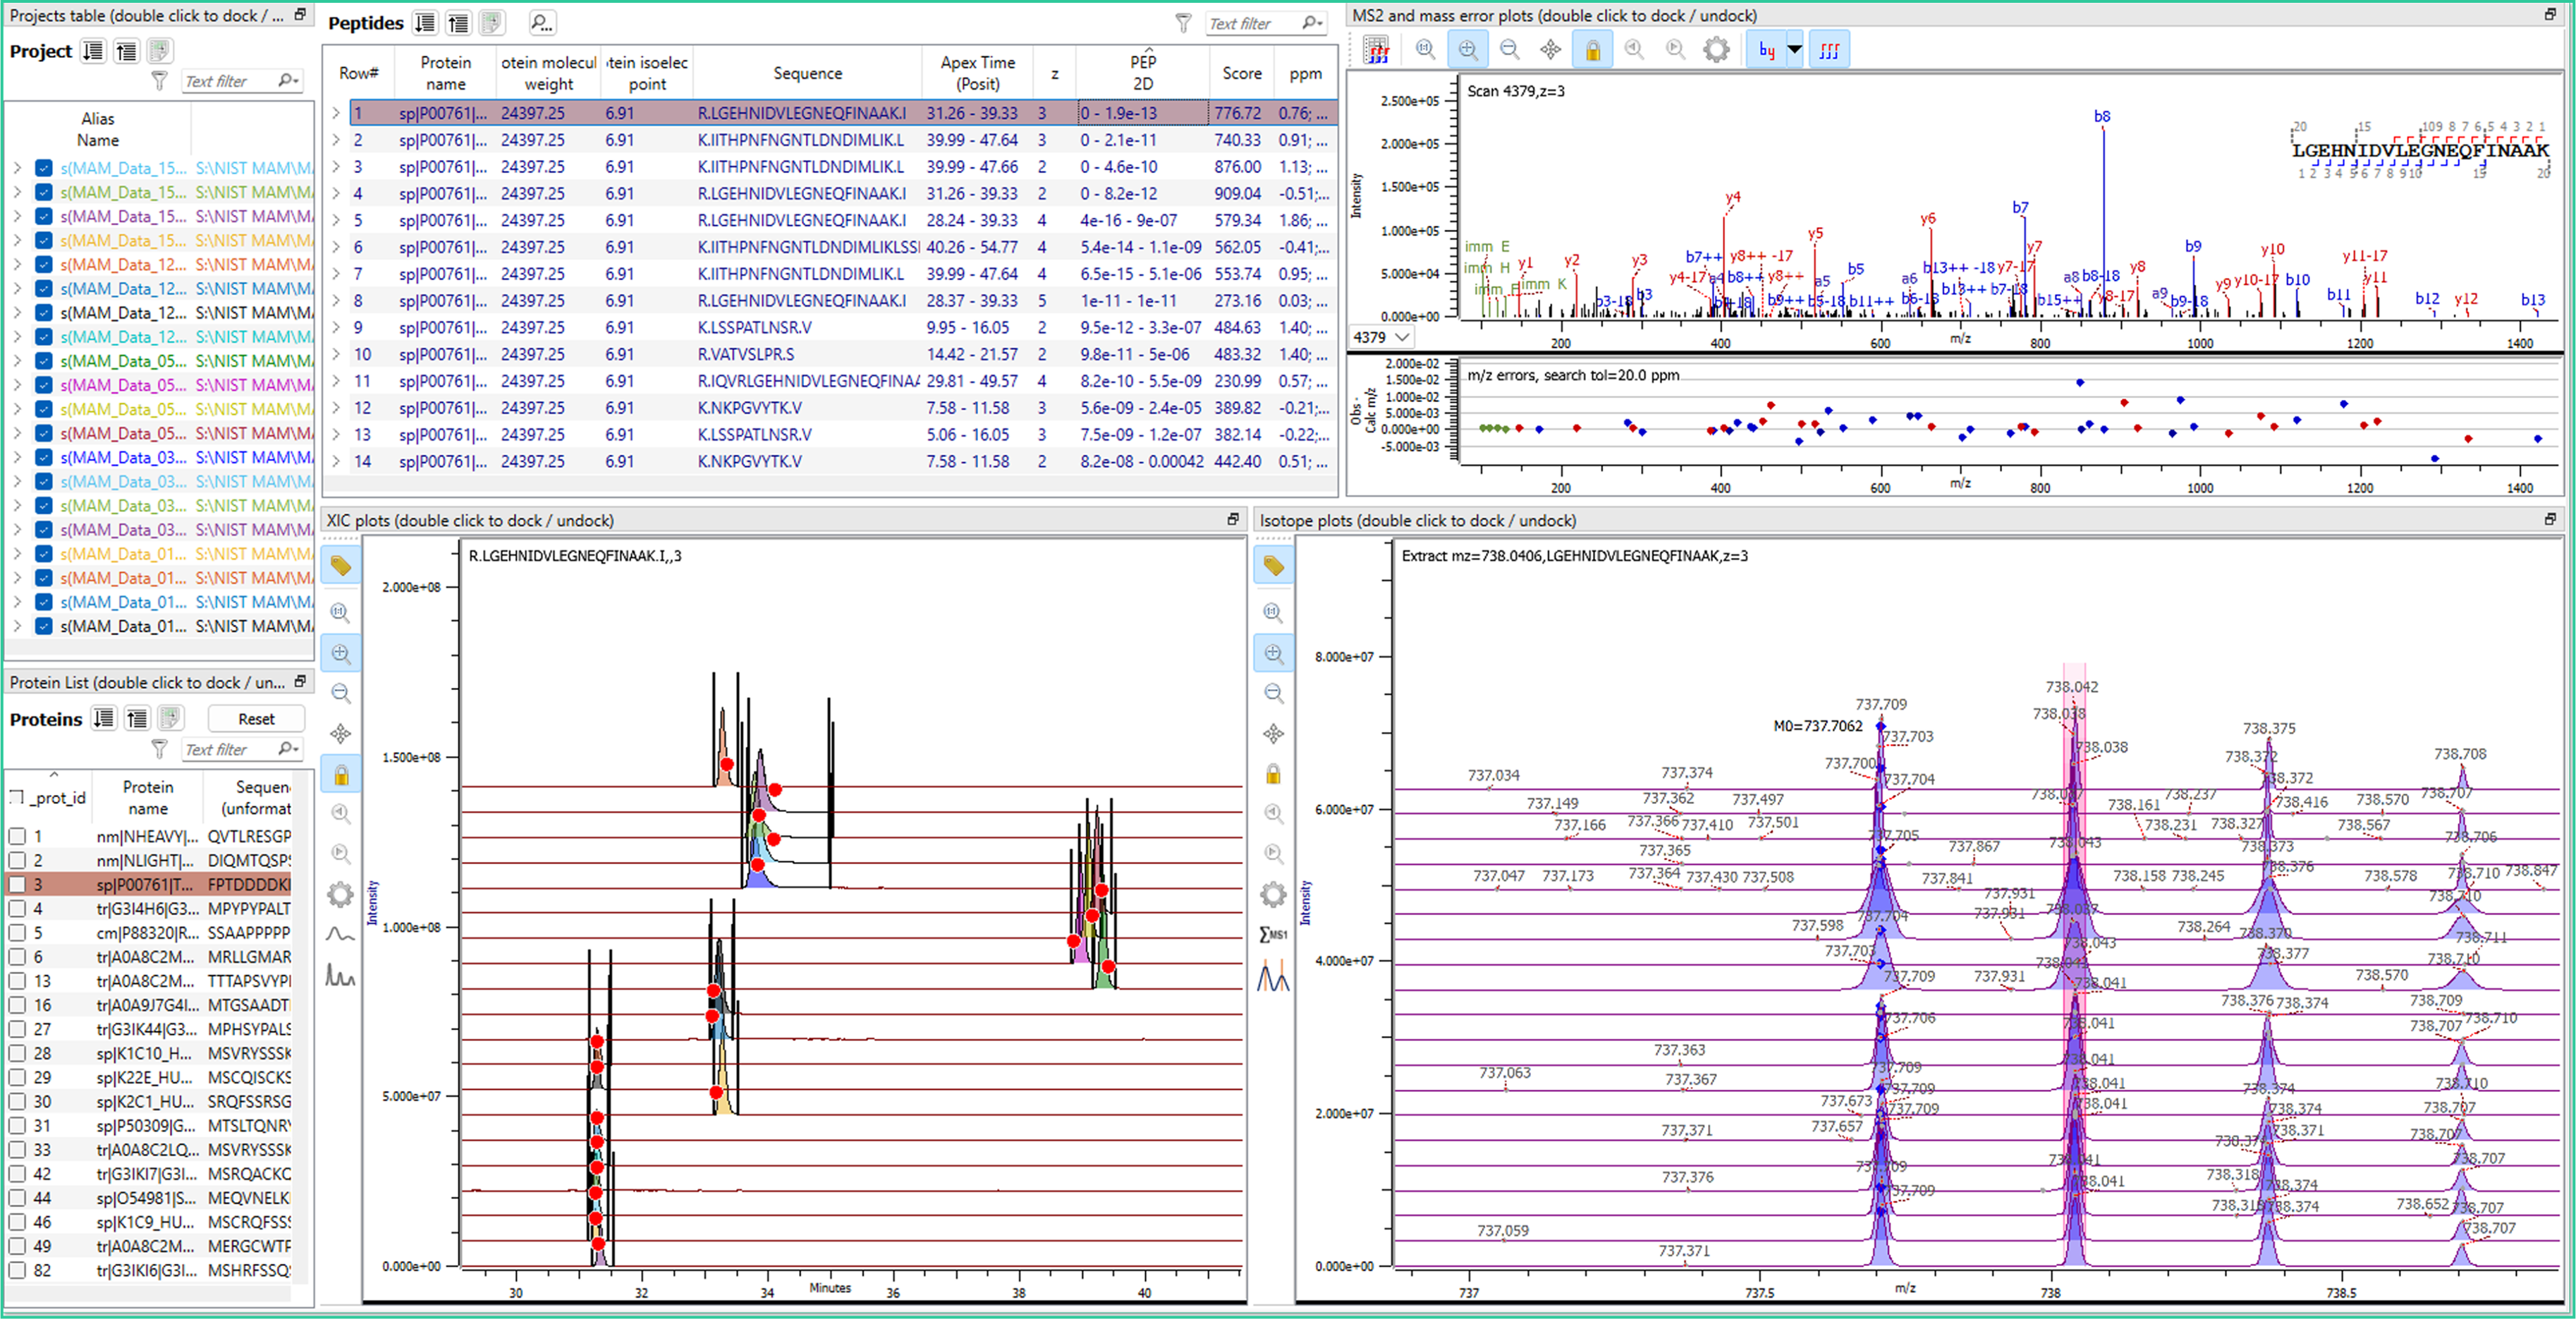
Filtering allows analyst control over peptide quantitation during (left) and after (right) project creation. New in v5.8 is the protein centric view that can be seen at the bottom left corner of the inspection view.
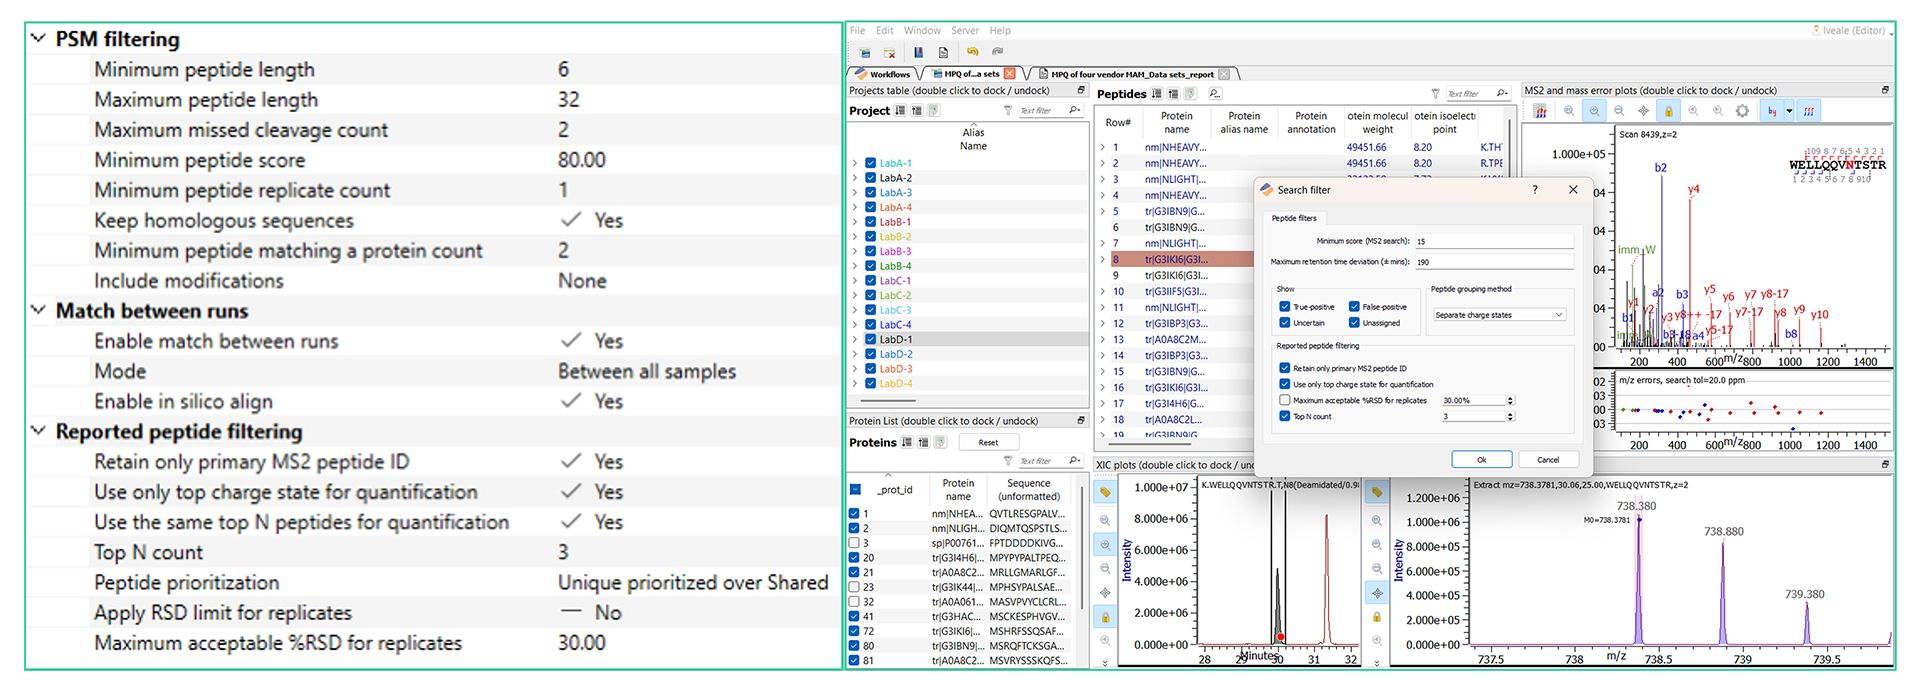
Identification and Quantitation Dynamic Inspection
Two Case Studies: NIST MAM Comparison Studies
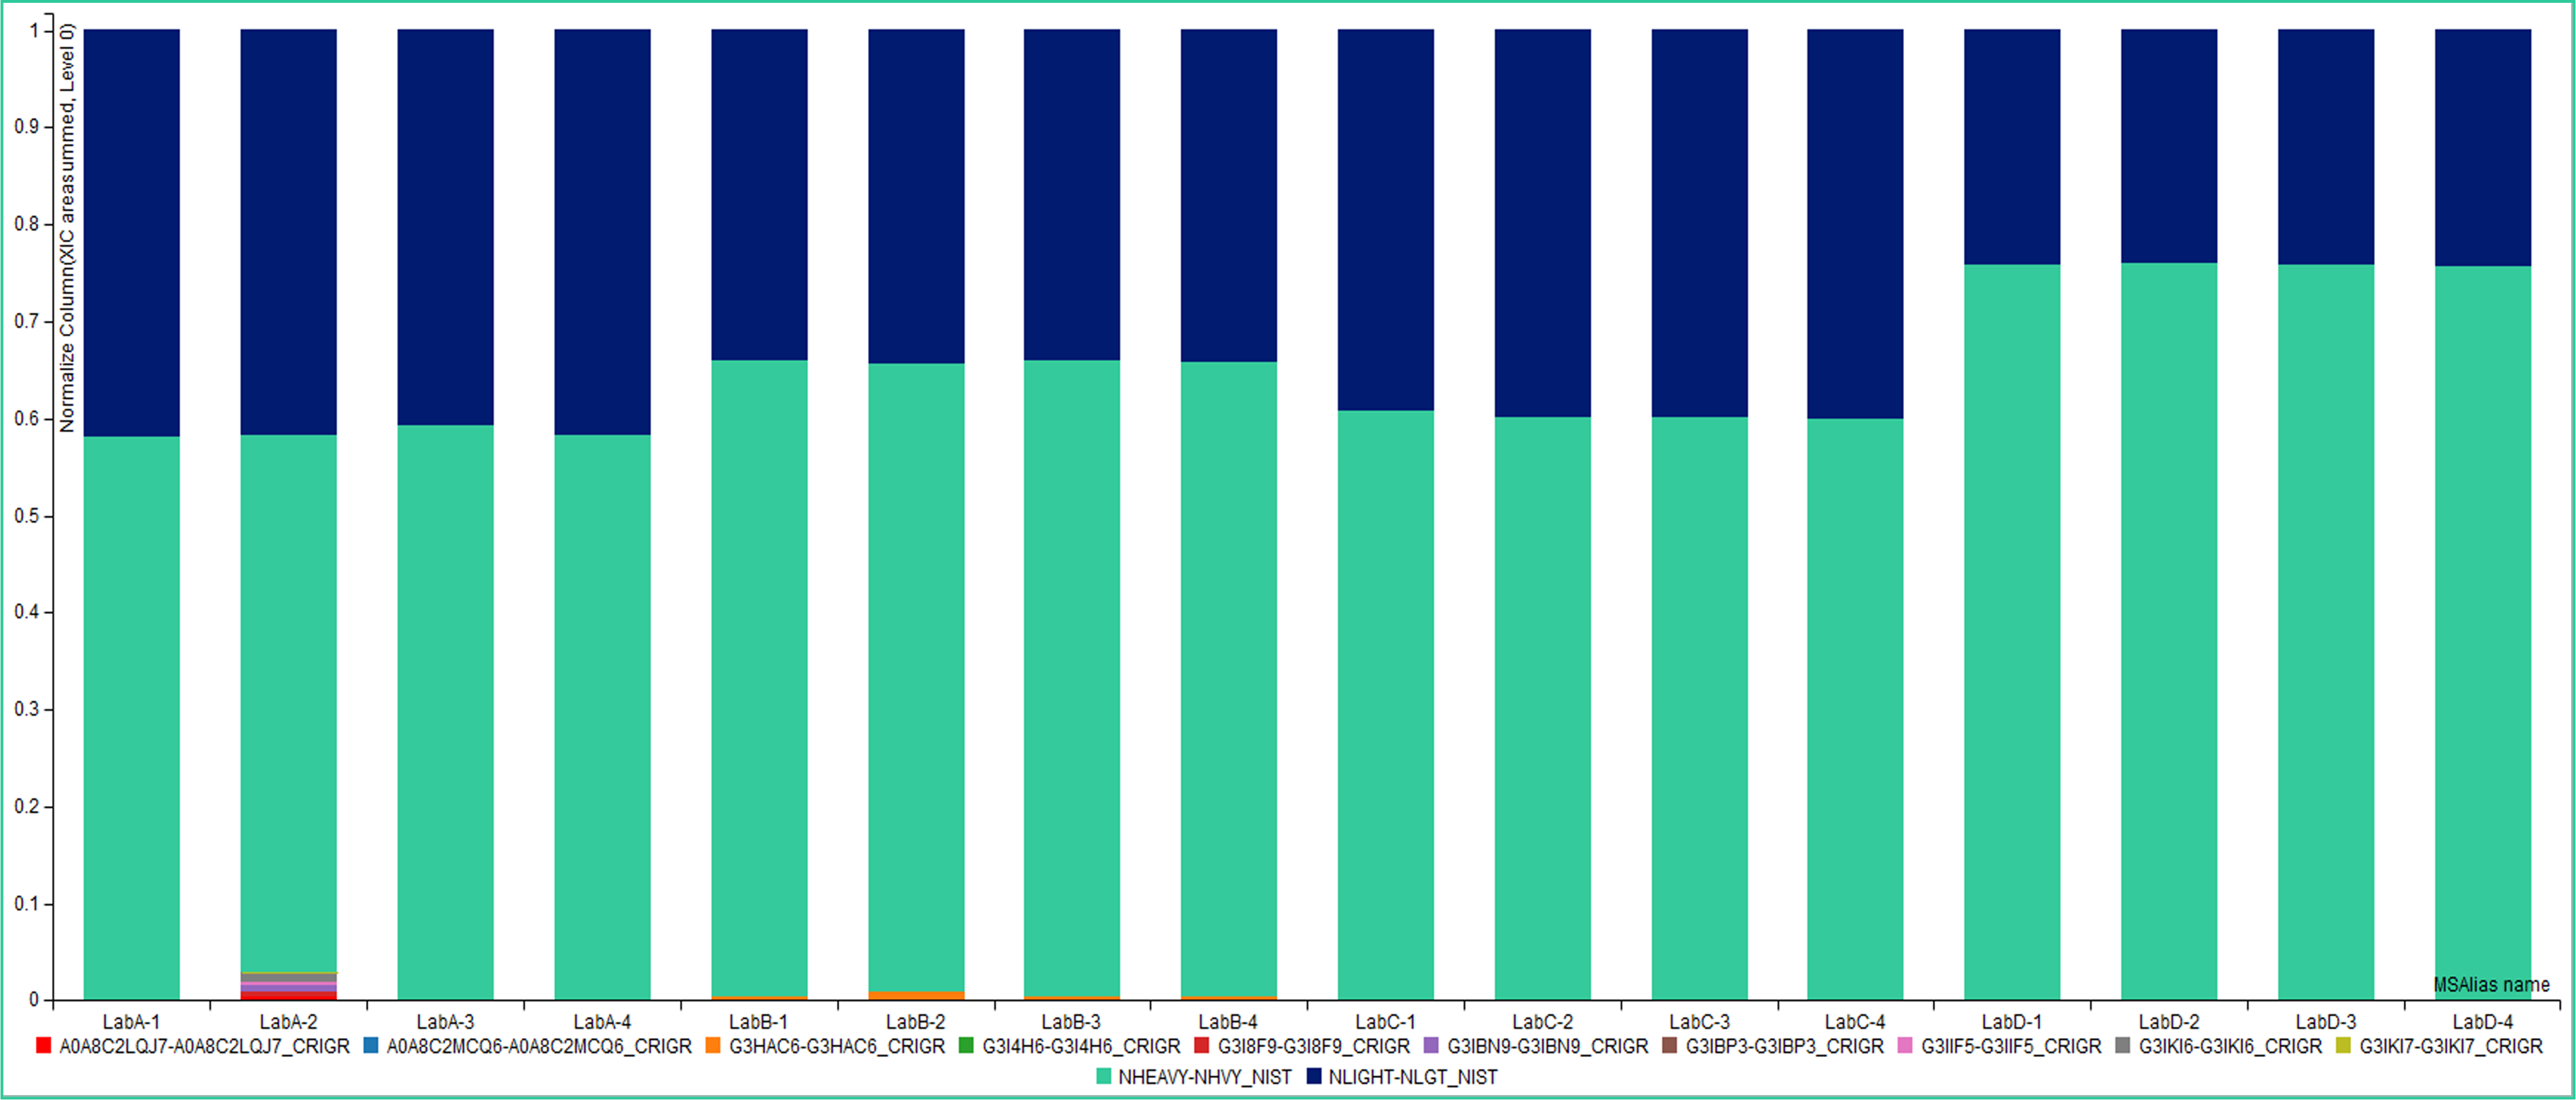
Normalized XIC Area Summed Comparison of All HCPs
Normalized XIC area summed of all proteins identified in samples from four different instruments in four different labs with four different conditions [(1) reference, (2) pH, (3) spiked, and (4) unknown]. Data suggests relatively similar amounts of NIST mAb heavy chain (green) and light chain (blue) for each instrument. Notably, a visually apparent amount of HCPs were found in the instruments Lab A-2 pH, and Lab B-1-4 samples.
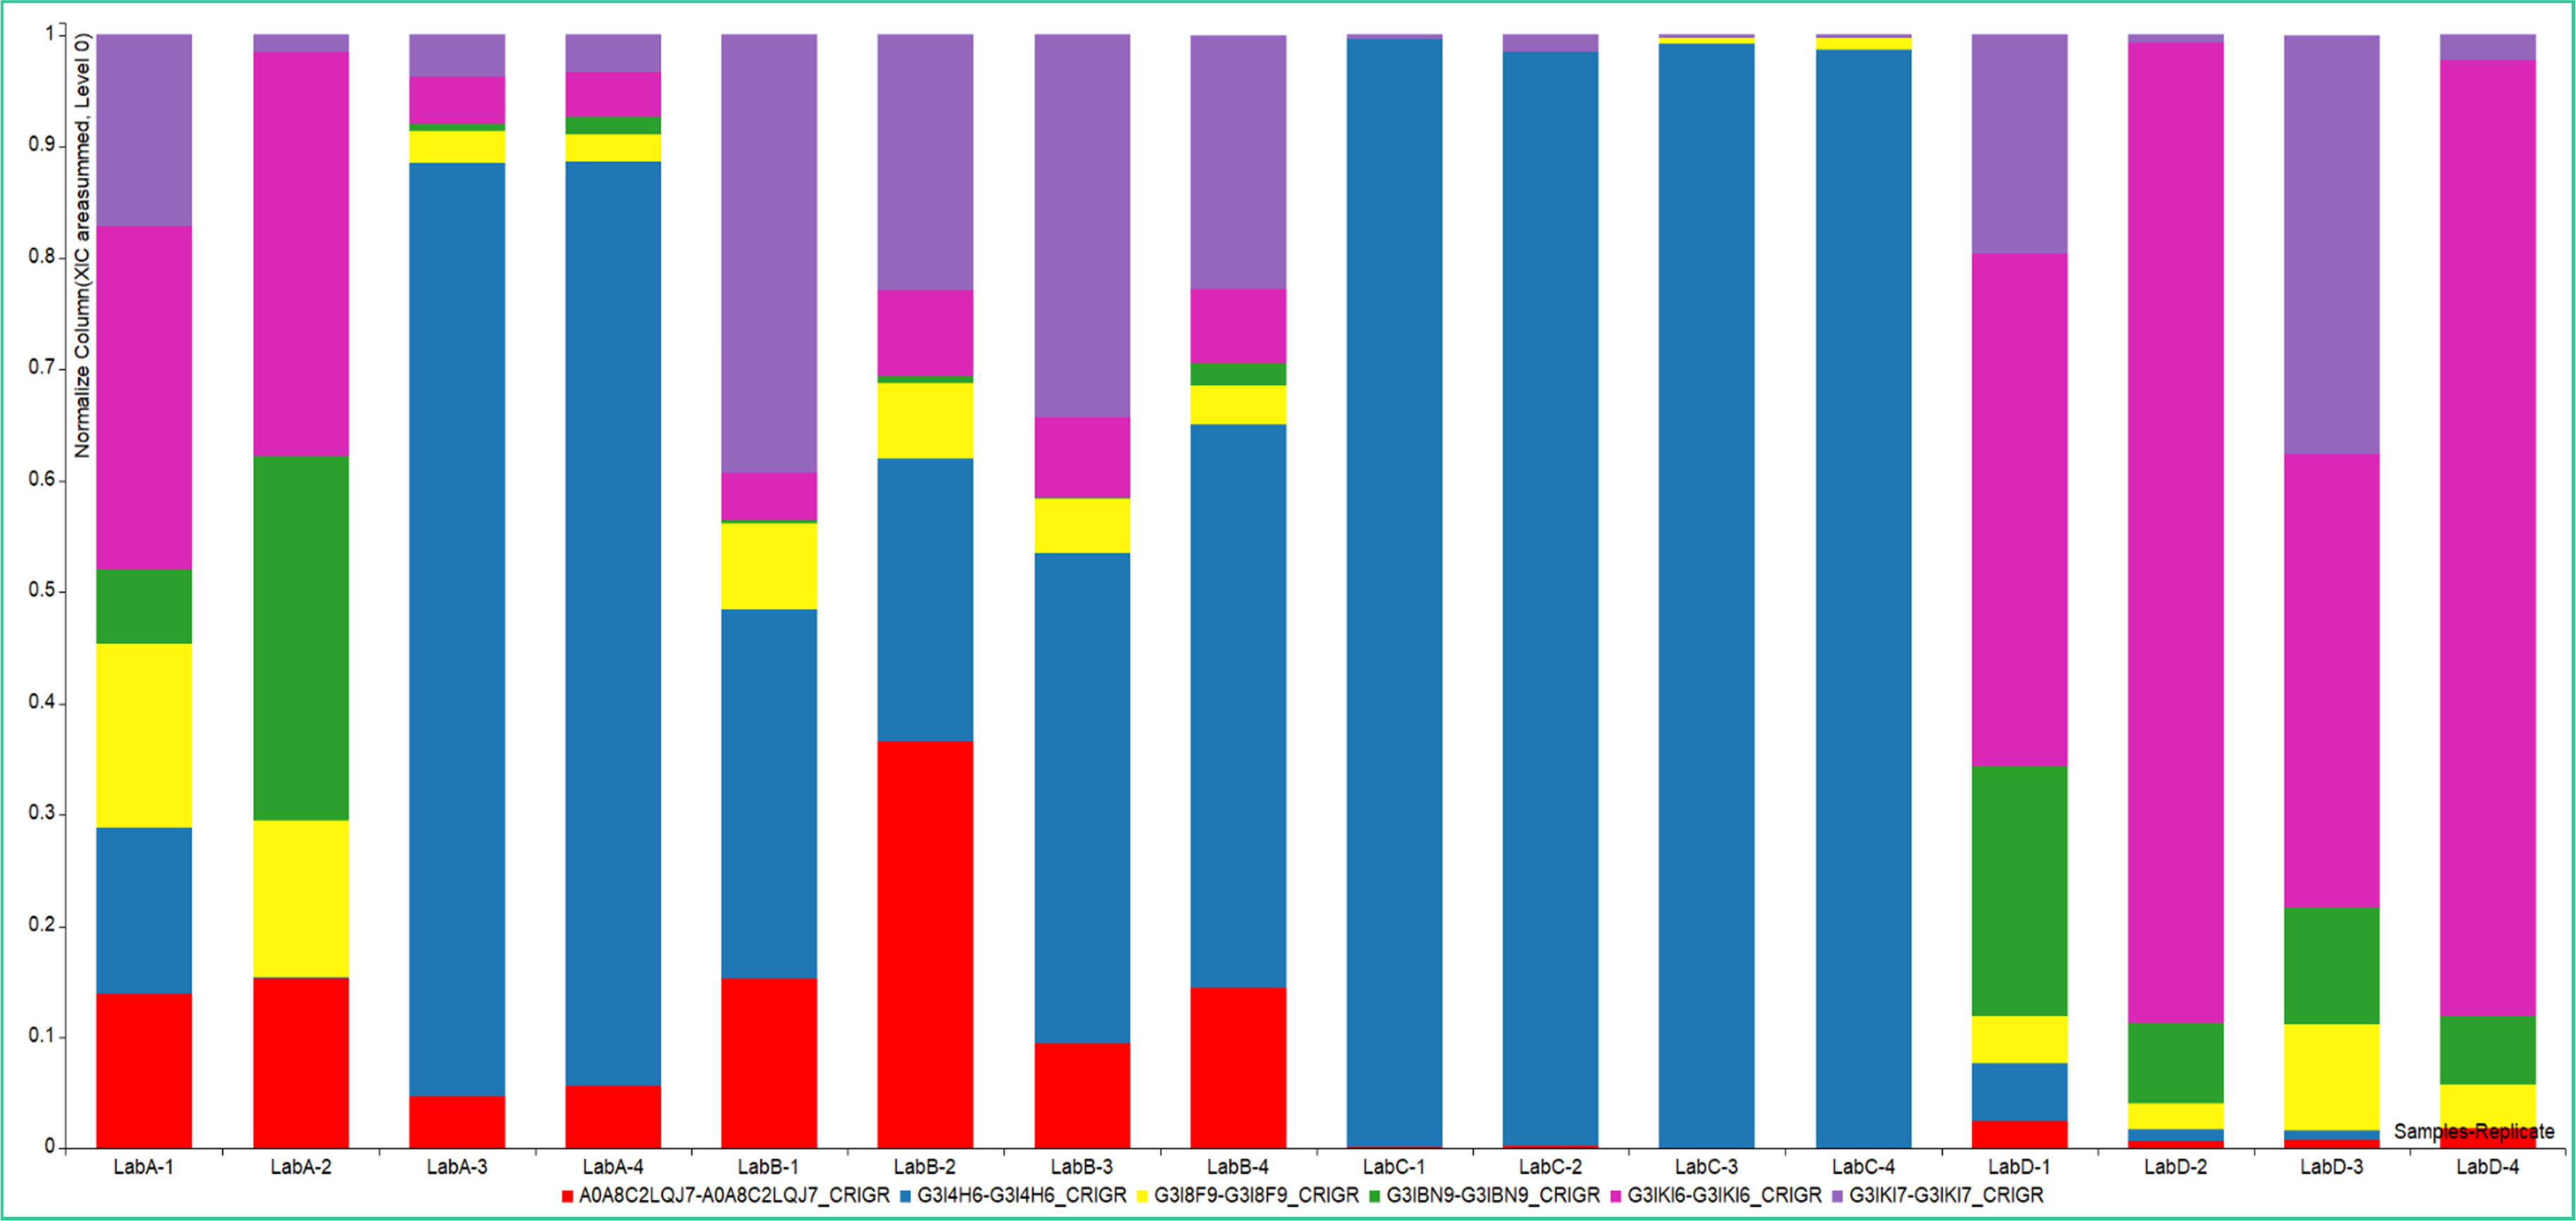
Normalized XIC Area Summed Comparison of Low Level HCPs
Zoomed in stacked bar chart of normalized XIC area summed amounts of low level HCPs that are identified in the samples. Automatically generated reports enable proteome-wide protein identification with a simple, protein-centric review capability
Multi-Lab Comparison with NIST
Inspection view of data sets from 5 labs containing 4 different conditions show integrated XICs using Match Between Runs to align peptide identifications across 20 datasets and differing retention times. New in v5.8 is the “protein centric view” that allows anaylsts to quickly filter and interrogate specific proteins. The inspection view, along with the automatically generated reports, offers a rapid assessment of sample preparation quality via analysis of mass spectrometer precision and resolution and enzyme digestion efficiency.
Dashboards Monitor HCPs With Deep Query
Dashboards allow for the active monitoring of Host Cell Protein levels across every phase of biopharmaceutical discovery and development from early cell line development to bioprocess optimization or antibody purification to FDA New Drug Application (NDA) submissions, through final drug purity verification and profiling of cell therapy samples.
Byosphere Dashboards Automatically Alert Out-of-Range Proteins
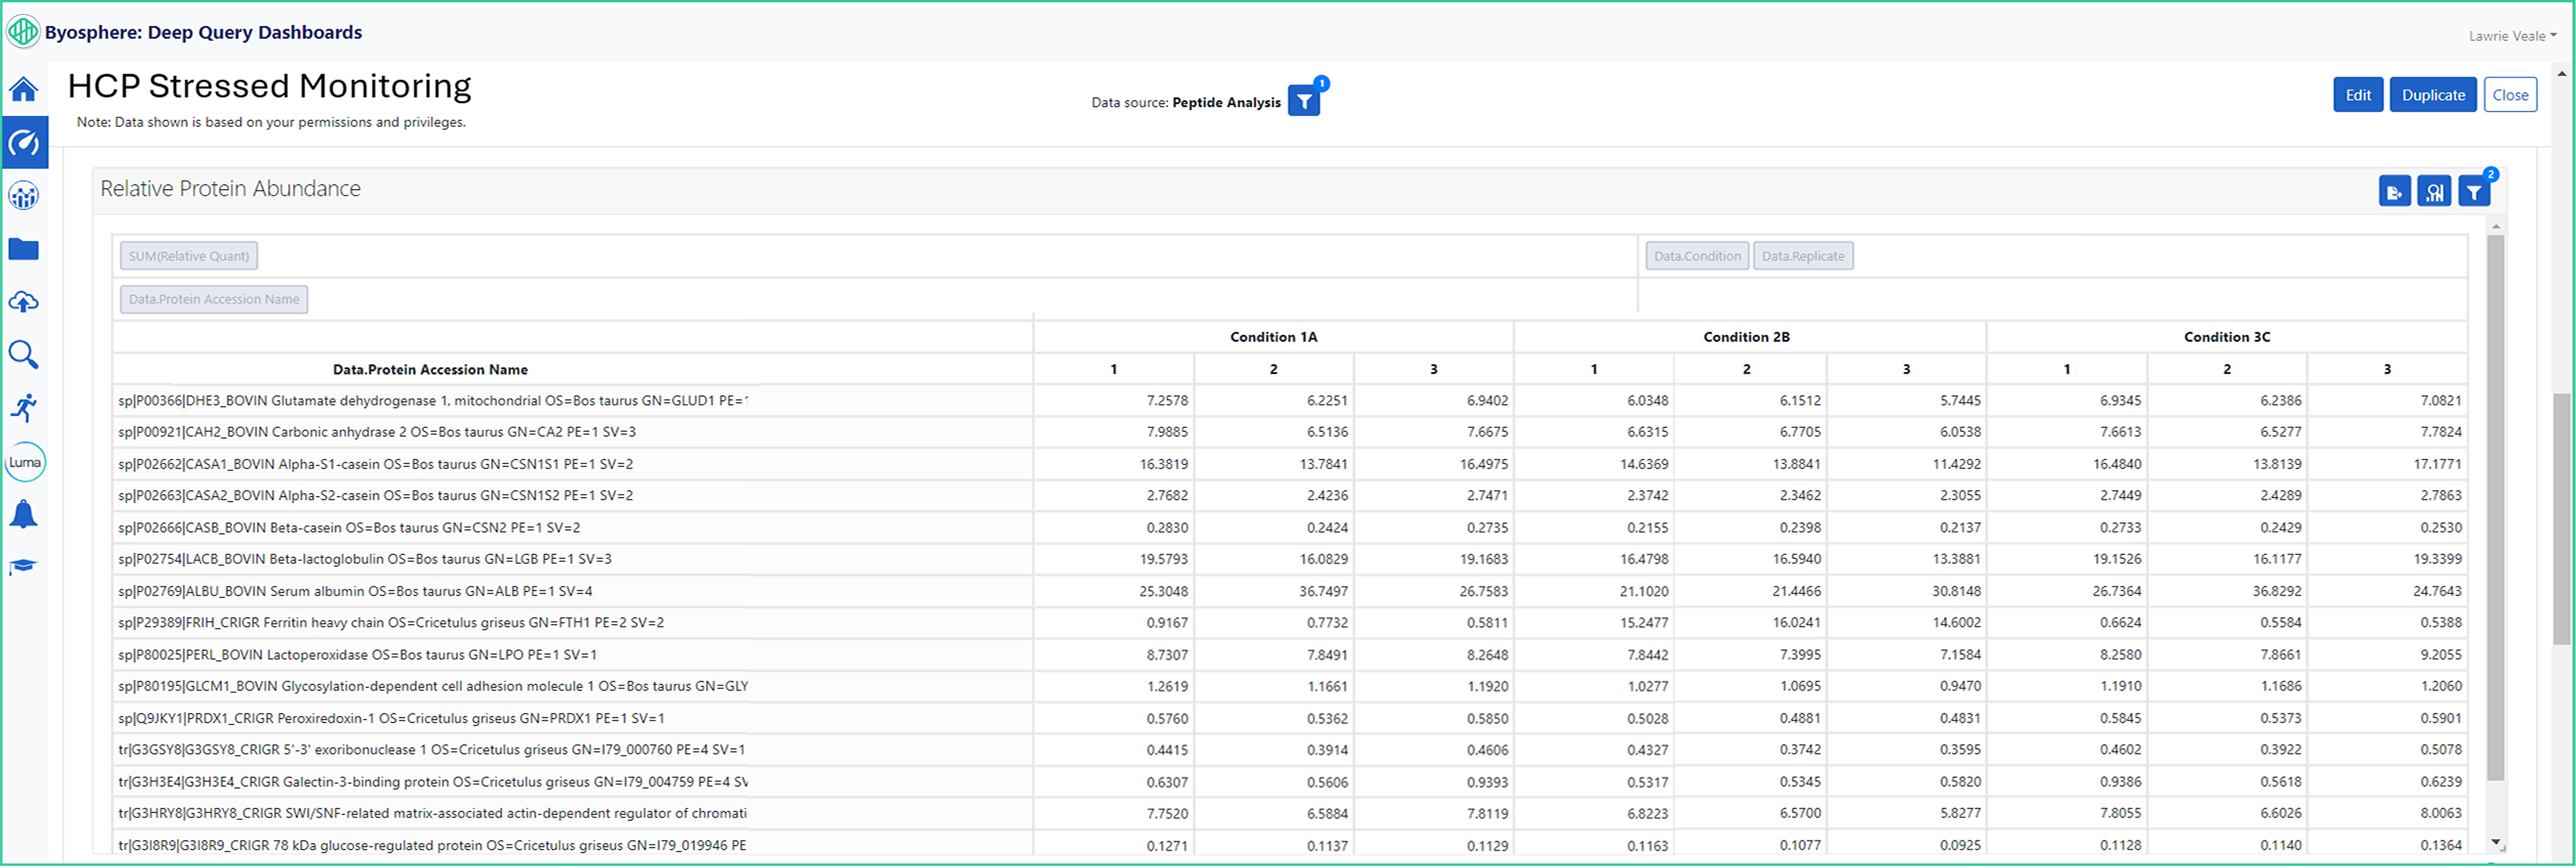
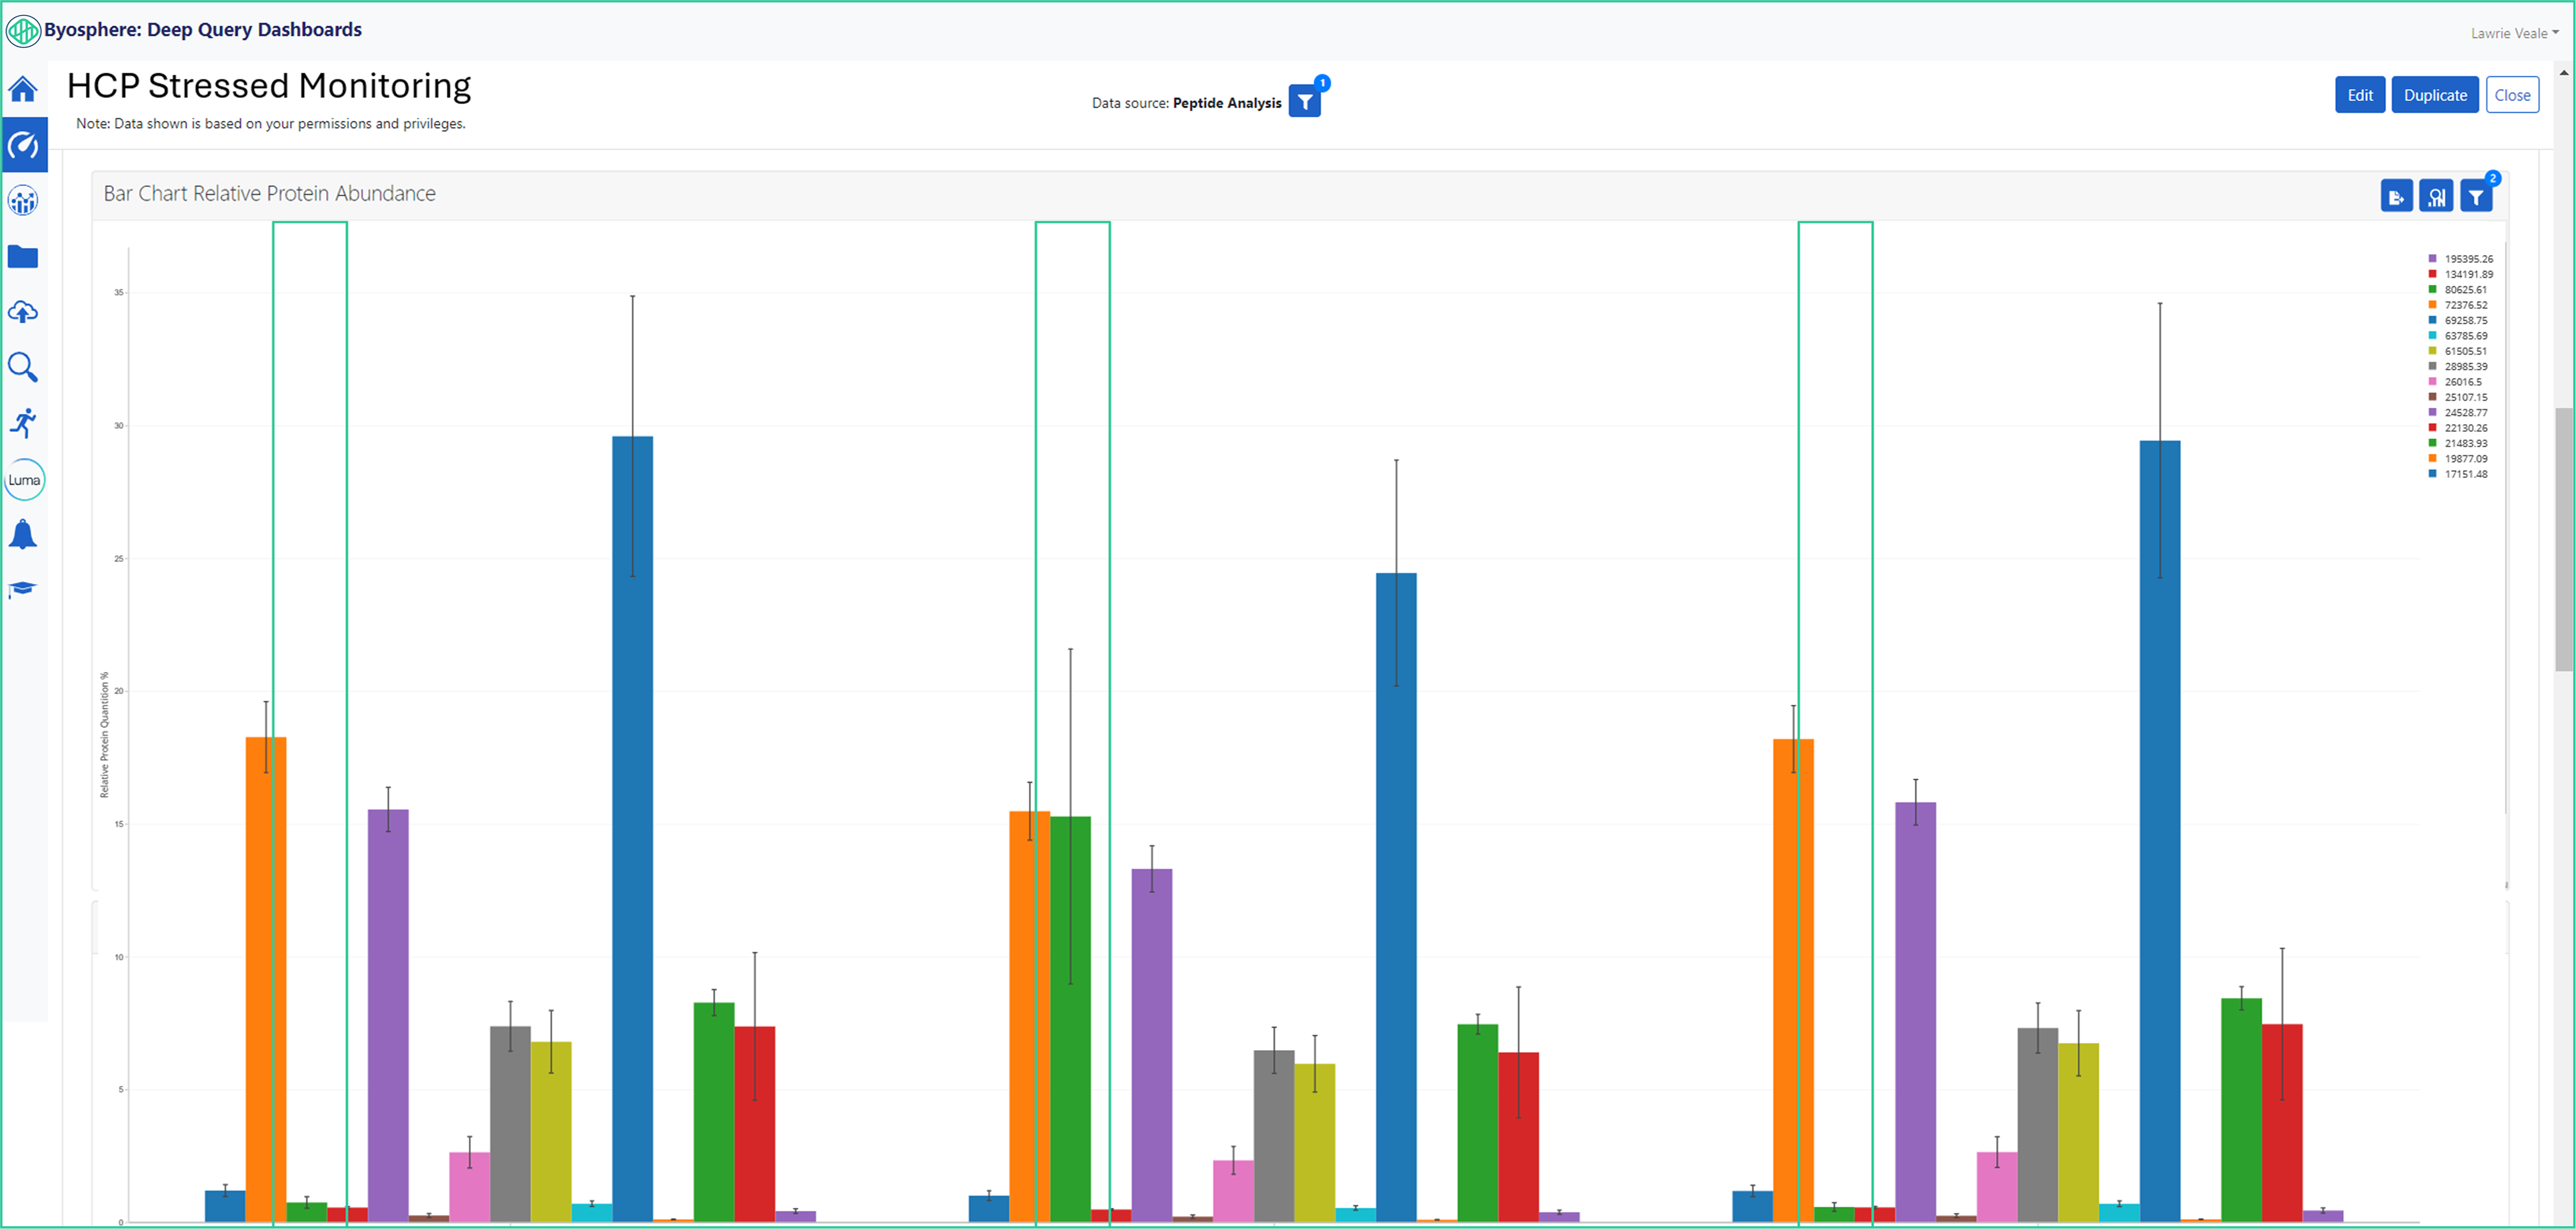
The HCP ferritin heavy chain has an elevated level for the condition 2B (green box) versus the levels that were detected in stress conditions 1A and 3C. Byosphere Dashboards are enabled with the ability to automatic alerts to notify if proteins of interest falls out of range.
Byosphere Dashboard Replicate Analysis Give Flexible Graphical Displays for Out-of-Range Proteins
Byosphere dashboards allow for the configuration of replicate comparison and different visulization of data sets. In the blue boxes, is the replicate analysis of the ferritin HCP that has increased relative protein abundance in the stressed condition 2B vs 1A and 1C samples.
Acknowledgements
The authors wish to thank Lucas Calestini from Real Retina Analytics for much appreciated help and advice.
